I recently published another scientific paper in the peer-reviewed journal PLoS ONE. Since PLoS ONE is Open Access, anyone can read the paper without a journal subscription:
Using Wind Setdown and Storm Surge on Lake Erie to Calibrate the Air-Sea Drag Coefficient
The publication date was August 19, 2013. Here is the full citation:
Drews C (2013) Using Wind Setdown and Storm Surge on Lake Erie to Calibrate the Air-Sea Drag Coefficient. PLoS ONE 8(8): e72510. doi:10.1371/journal.pone.0072510
The purpose of the research was to validate the results of the COAWST ocean model (Coupled-Ocean-Atmosphere-Wave- Sediment Transport Modeling System) with actual observations of storm surge. The paper has a lot of figures that we call “spaghetti plots;” these are charts that show multiple time series on a single plot. We call them spaghetti plots because they look like a bunch of noodles stretched from left to right across the page:
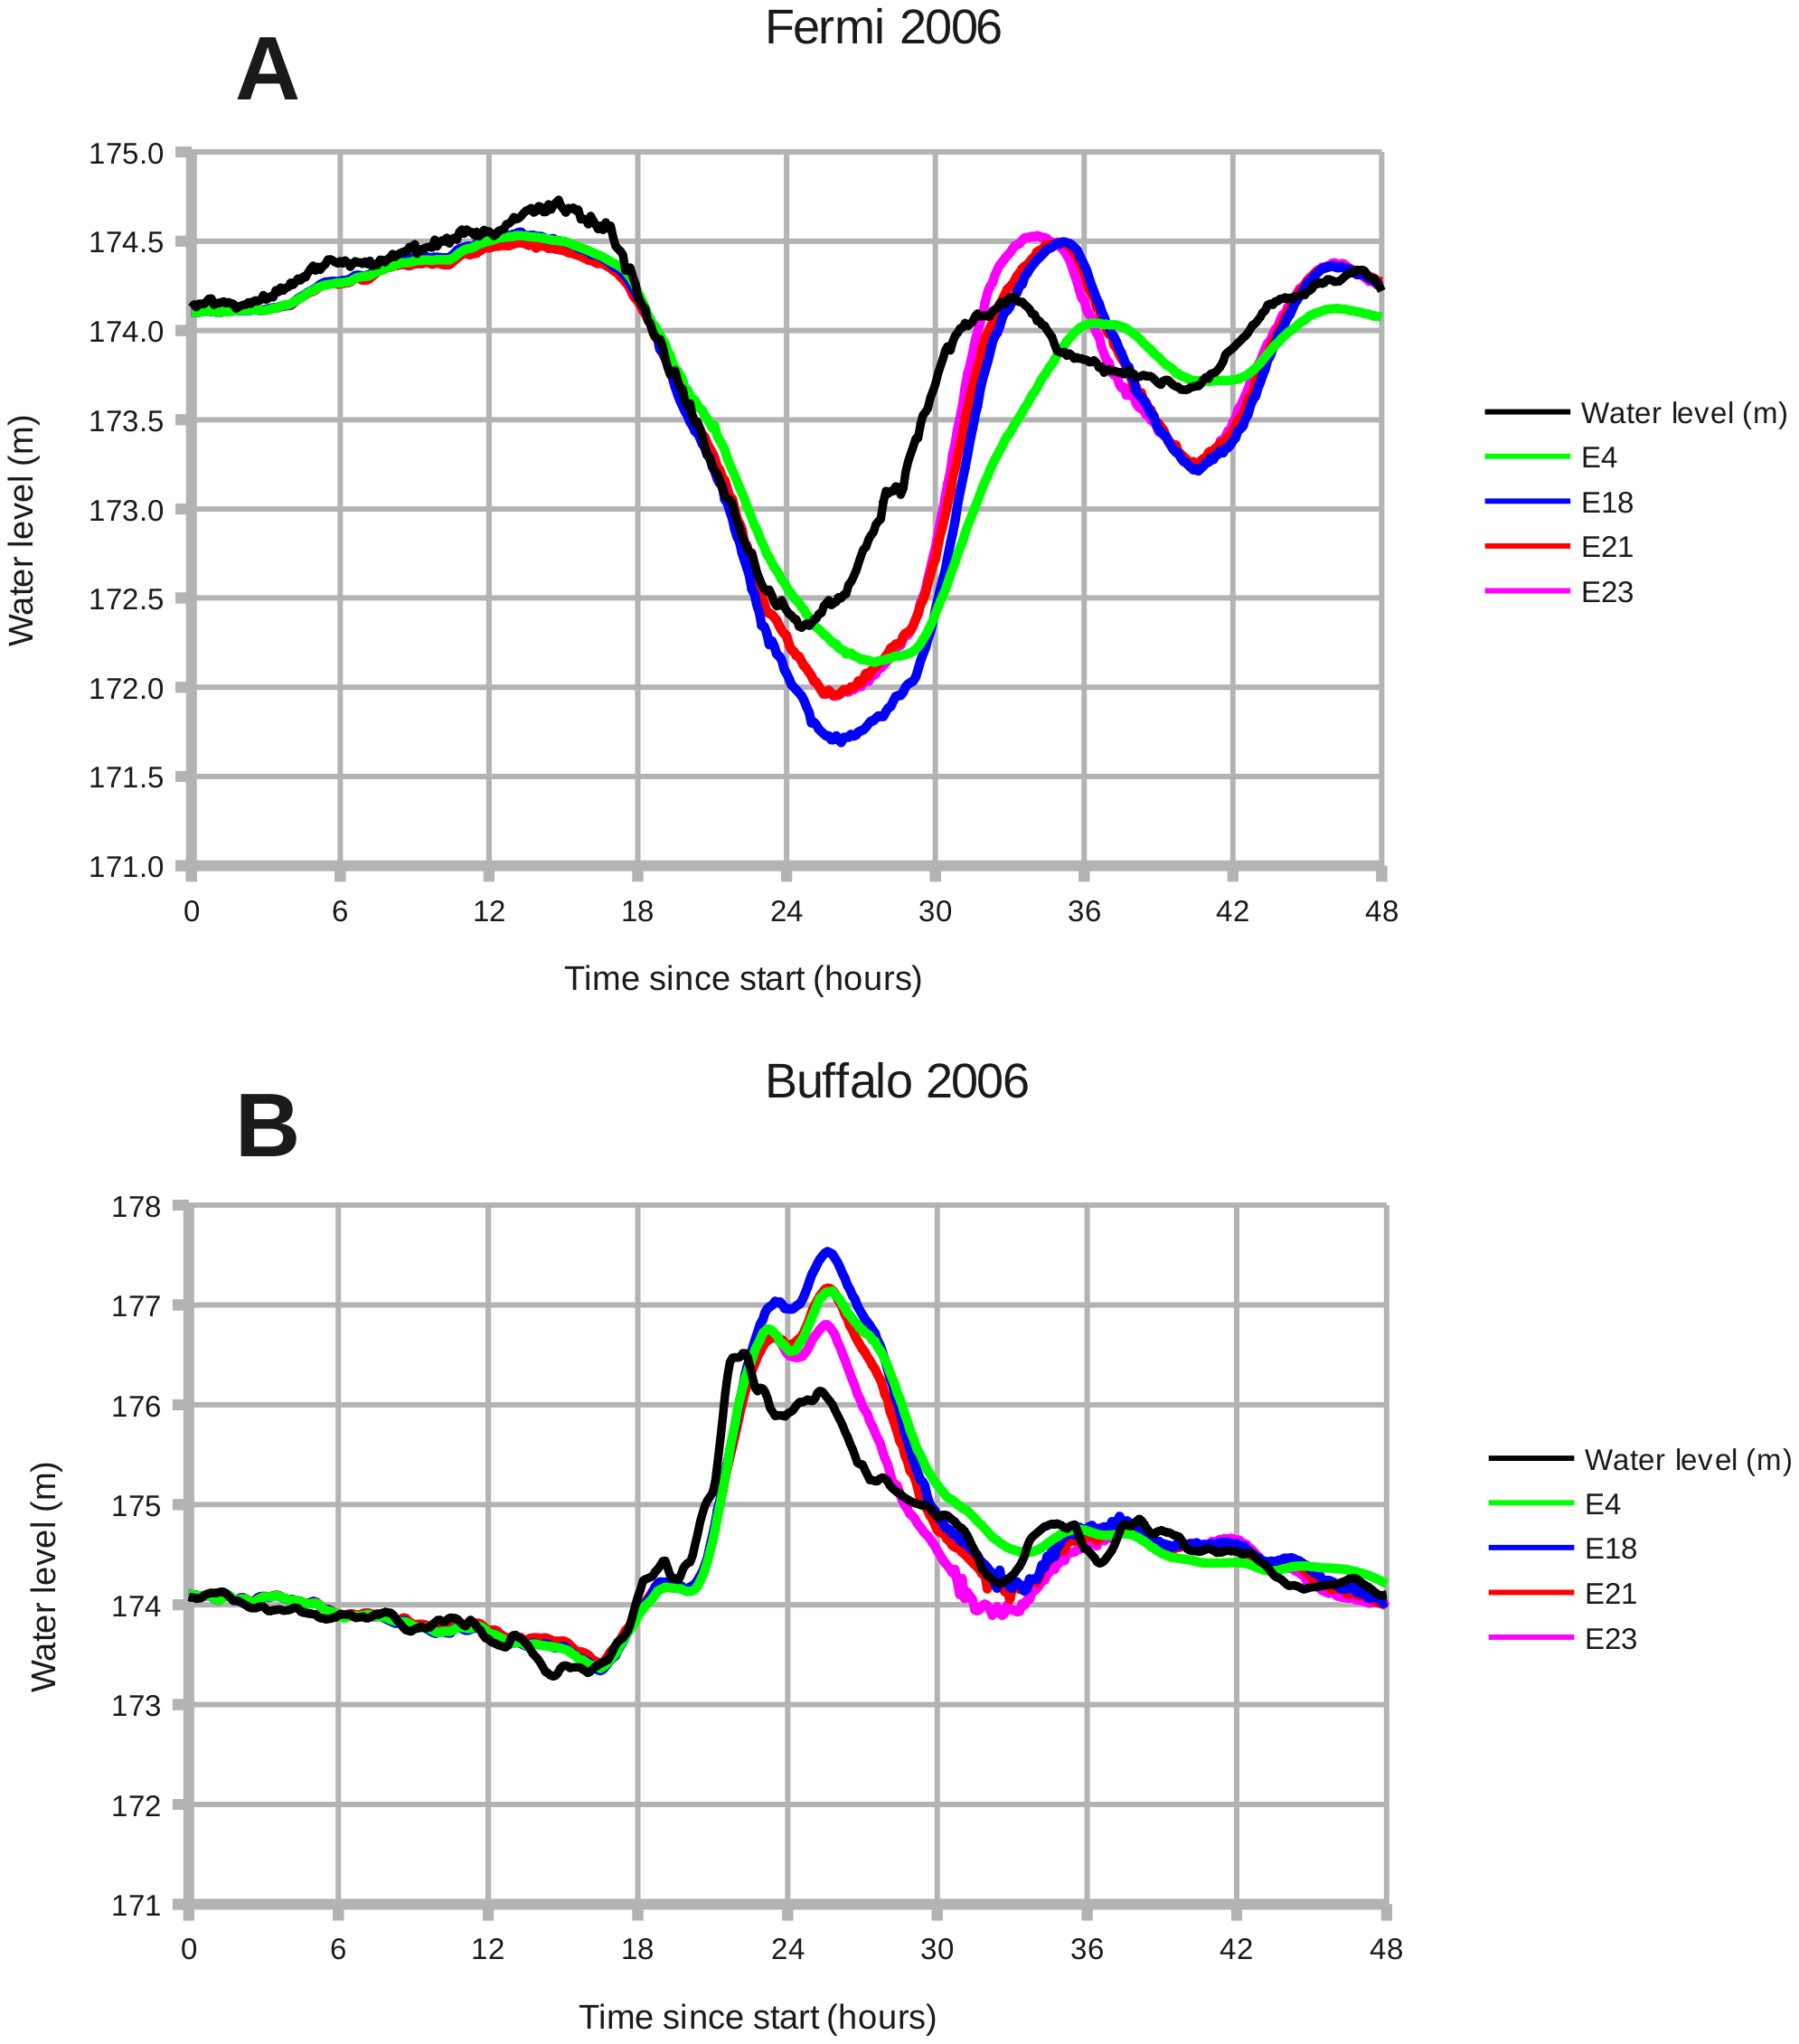
Figure 11. December 2006: Wind setdown and storm surge, with experiments E4, E18, E21, and E23. From Drews (2013).
In Figure 11, the black line represents the observations of water level taken at the Fermi power plant at the western end of the lake, and at Buffalo at the eastern end of the lake. The colored lines represent various model runs. The goal here is to get the colored lines to match the black line as closely as possible. This is done by adjusting the COAWST model parameters in a sensible manner. Adjustments include: the numerical formula for the air-sea drag coefficient, the bottom drag coefficient, the influence of waves, and the algorithm used to simulate wave action, and the presence of ice on the lake.
Why Lake Erie? Lake Erie happens to be a near-perfect natural laboratory for conducting this kind of experiment. The lake is long, shallow, and subject to strong winds from the west that cause the lake water to slosh back and forth like a big bathtub. Since the lake is surrounded by populated areas in the United States and Canada, there are many weather stations along the coastline that provide archived meteorological data. Lake Erie is also an important seaway for international commerce, and NOAA provides accurate measurements of tides and currents at major ports on the lake. I can run simulation experiments with confidence in the observations that I am trying to match.
The paper describes two windstorms on Lake Erie: December 1–2, 2006 and January 30–31, 2008. Lake Erie is 400 km long and 90 km wide. Since I don’t have a gigantic fan big enough to blow the lake water around and measure what happens, I have to wait for nature to do the blowing instead. Fortunately for me, these windstorms occur often enough to provide several usable data sets. Better yet, there were no human fatalities in either of these storms.
The potential result of the research is a more accurate model for storm surge. When building coastal defenses such as floodwalls, it is crucial to know how high the ocean will rise when the next hurricane comes ashore. The difference between building a seawall one foot higher than the maximum surge, and one foot lower than the maximum surge, can be disastrous.
Moses Crossing the Red Sea
In 2010 I published another paper on wind setdown and storm surge:
Dynamics of Wind Setdown at Suez and the Eastern Nile Delta
That earlier paper reported the emergence of a land bridge in the eastern Nile delta under certain conditions of wind speed and direction. For readers of funmurphys who are interested in Moses crossing the Red Sea, the ocean model indicated that Moses would have 4 hours to lead the Israelites across the yam suf.
At the time, I suspected that the estimate of 4.0 hours was somewhat conservative; that is, the dry passage probably would have stayed open for a longer period of time. There were several factors that we did not include in the 2010 research, such as waves and a drag coefficient more suited to coastal conditions. I had a hunch that these additional factors would increase the duration of the passage. However, the rigorous nature of scientific publishing requires that scientists cannot publish more than a few paragraphs of speculation; peer-reviewed journals require concrete results supported by evidence from observations and computer models.
The Lake Erie research provided a chance for me to test my earlier hunch. I was pleased to find that my hunch was correct; but better yet, that I could provide a revised number for the crossing time. Here it is: Moses had over 8 hours to evacuate all the Israelites from Pi-Hahiroth to safety at Tell Kedua on the other side of the yam suf. Or, for scholars who are more interested in the wind speed, an east wind blowing at 24 meters per second is sufficient to hold open the dry passage for 4 hours (the 2010 paper reported 28 m/s).
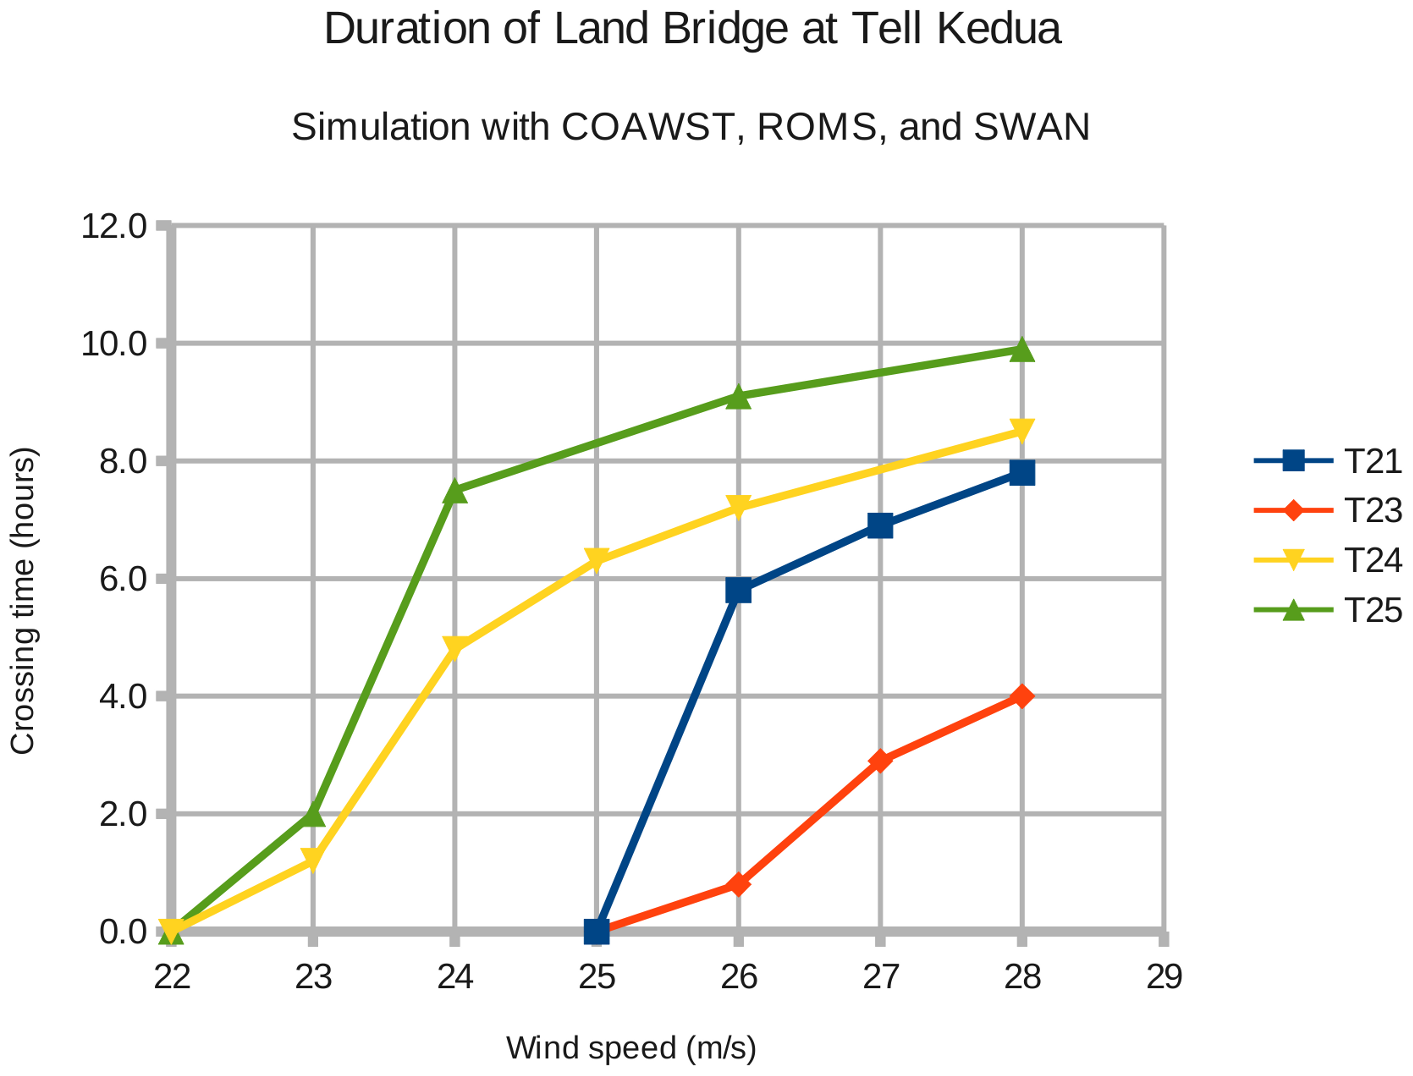
Figure 13. Corrections applied to the Lake of Tanis and the Kedua Gap. From Drews (2013).
I like this result, because it shows that there is some engineering tolerance to the solution. Although God can of course do anything He wants to do, as an engineer I am happier with a answer in which the parameters can vary a bit and still work. The 2013 paper demonstrates that the Kedua Gap is a more robust reconstruction of Exodus 14 than originally thought.